


#12-08 | INCOMING ECON DATA, $SPX CONSOLIDATES BETWEEN VAH/VAL, $COST ER, WHEN EASY MONEY DRAWS UP $CVNA 98% LOSS
Key areas are holding on the $SPX

Today, the price consolidated between the VAH (Value Area High) and VAL (Value Area Low). This indicates that the market is consolidating and traders are unsure of which direction the price will move next.
By trading within the range of prices where most of the trading activity occurred during a given period, the market is indicating a state of indecision. It is crucial to monitor the price and other indicators carefully when it is trading within the value area to identify potential trading opportunities or changes in market sentiment.

The market is awaiting the release of all economic data, with particular focus on the speeches of the Fed Chair Powell and the numbers for Continuing Jobless Claims and Initial Jobless Claims.
Regardless of what the CPI data shows next week, the market is likely to pay closer attention to Powell's speech on the following day.
Continuing Jobless Claims EST 1,600K and Initial Jobless Claims EST 230K
If the Continuing Jobless Claims and Initial Jobless Claims comes in higher than expected, it may indicate a weak labor market and decrease in consumer spending, aligning with the actions that the Federal Reserve is looking for in order to cool inflation and achieve price stability.
A key factor to consider when assessing the market's risks for tomorrow and into Friday is the release of Costco earnings tomorrow and the PPI news on Friday. Due to the likelihood that producers will pass on any increases in their costs to consumers, the PPI is considered a leading indicator of consumer inflation.
Consumers could suffer from lower consumer spending if inflation increases, negatively affecting S&P 500 companies' performance. It is possible that an unexpected increase in the PPI will result in a decrease in the S&P 500's price. Conversely, a lower PPI could indicate lower consumer inflation in the future, which could be positive for the S&P 500.
Inflation doesn't significantly impact Costco's small margins as suppliers compete to partner with them. The company's primary sources of income are membership fees and Citi credit cards. It is able to weather market volatility well because of its unique business model, which takes a loss on items like hot dogs and gasoline.
S&P500 E-Mini Futures
For net longs to break out of the consolidation between VAH and VAL to the upside, the numbers will need to come in higher than expected. Once the TPOs are established one time framing higher, we can use that as a signal for direction to go long.
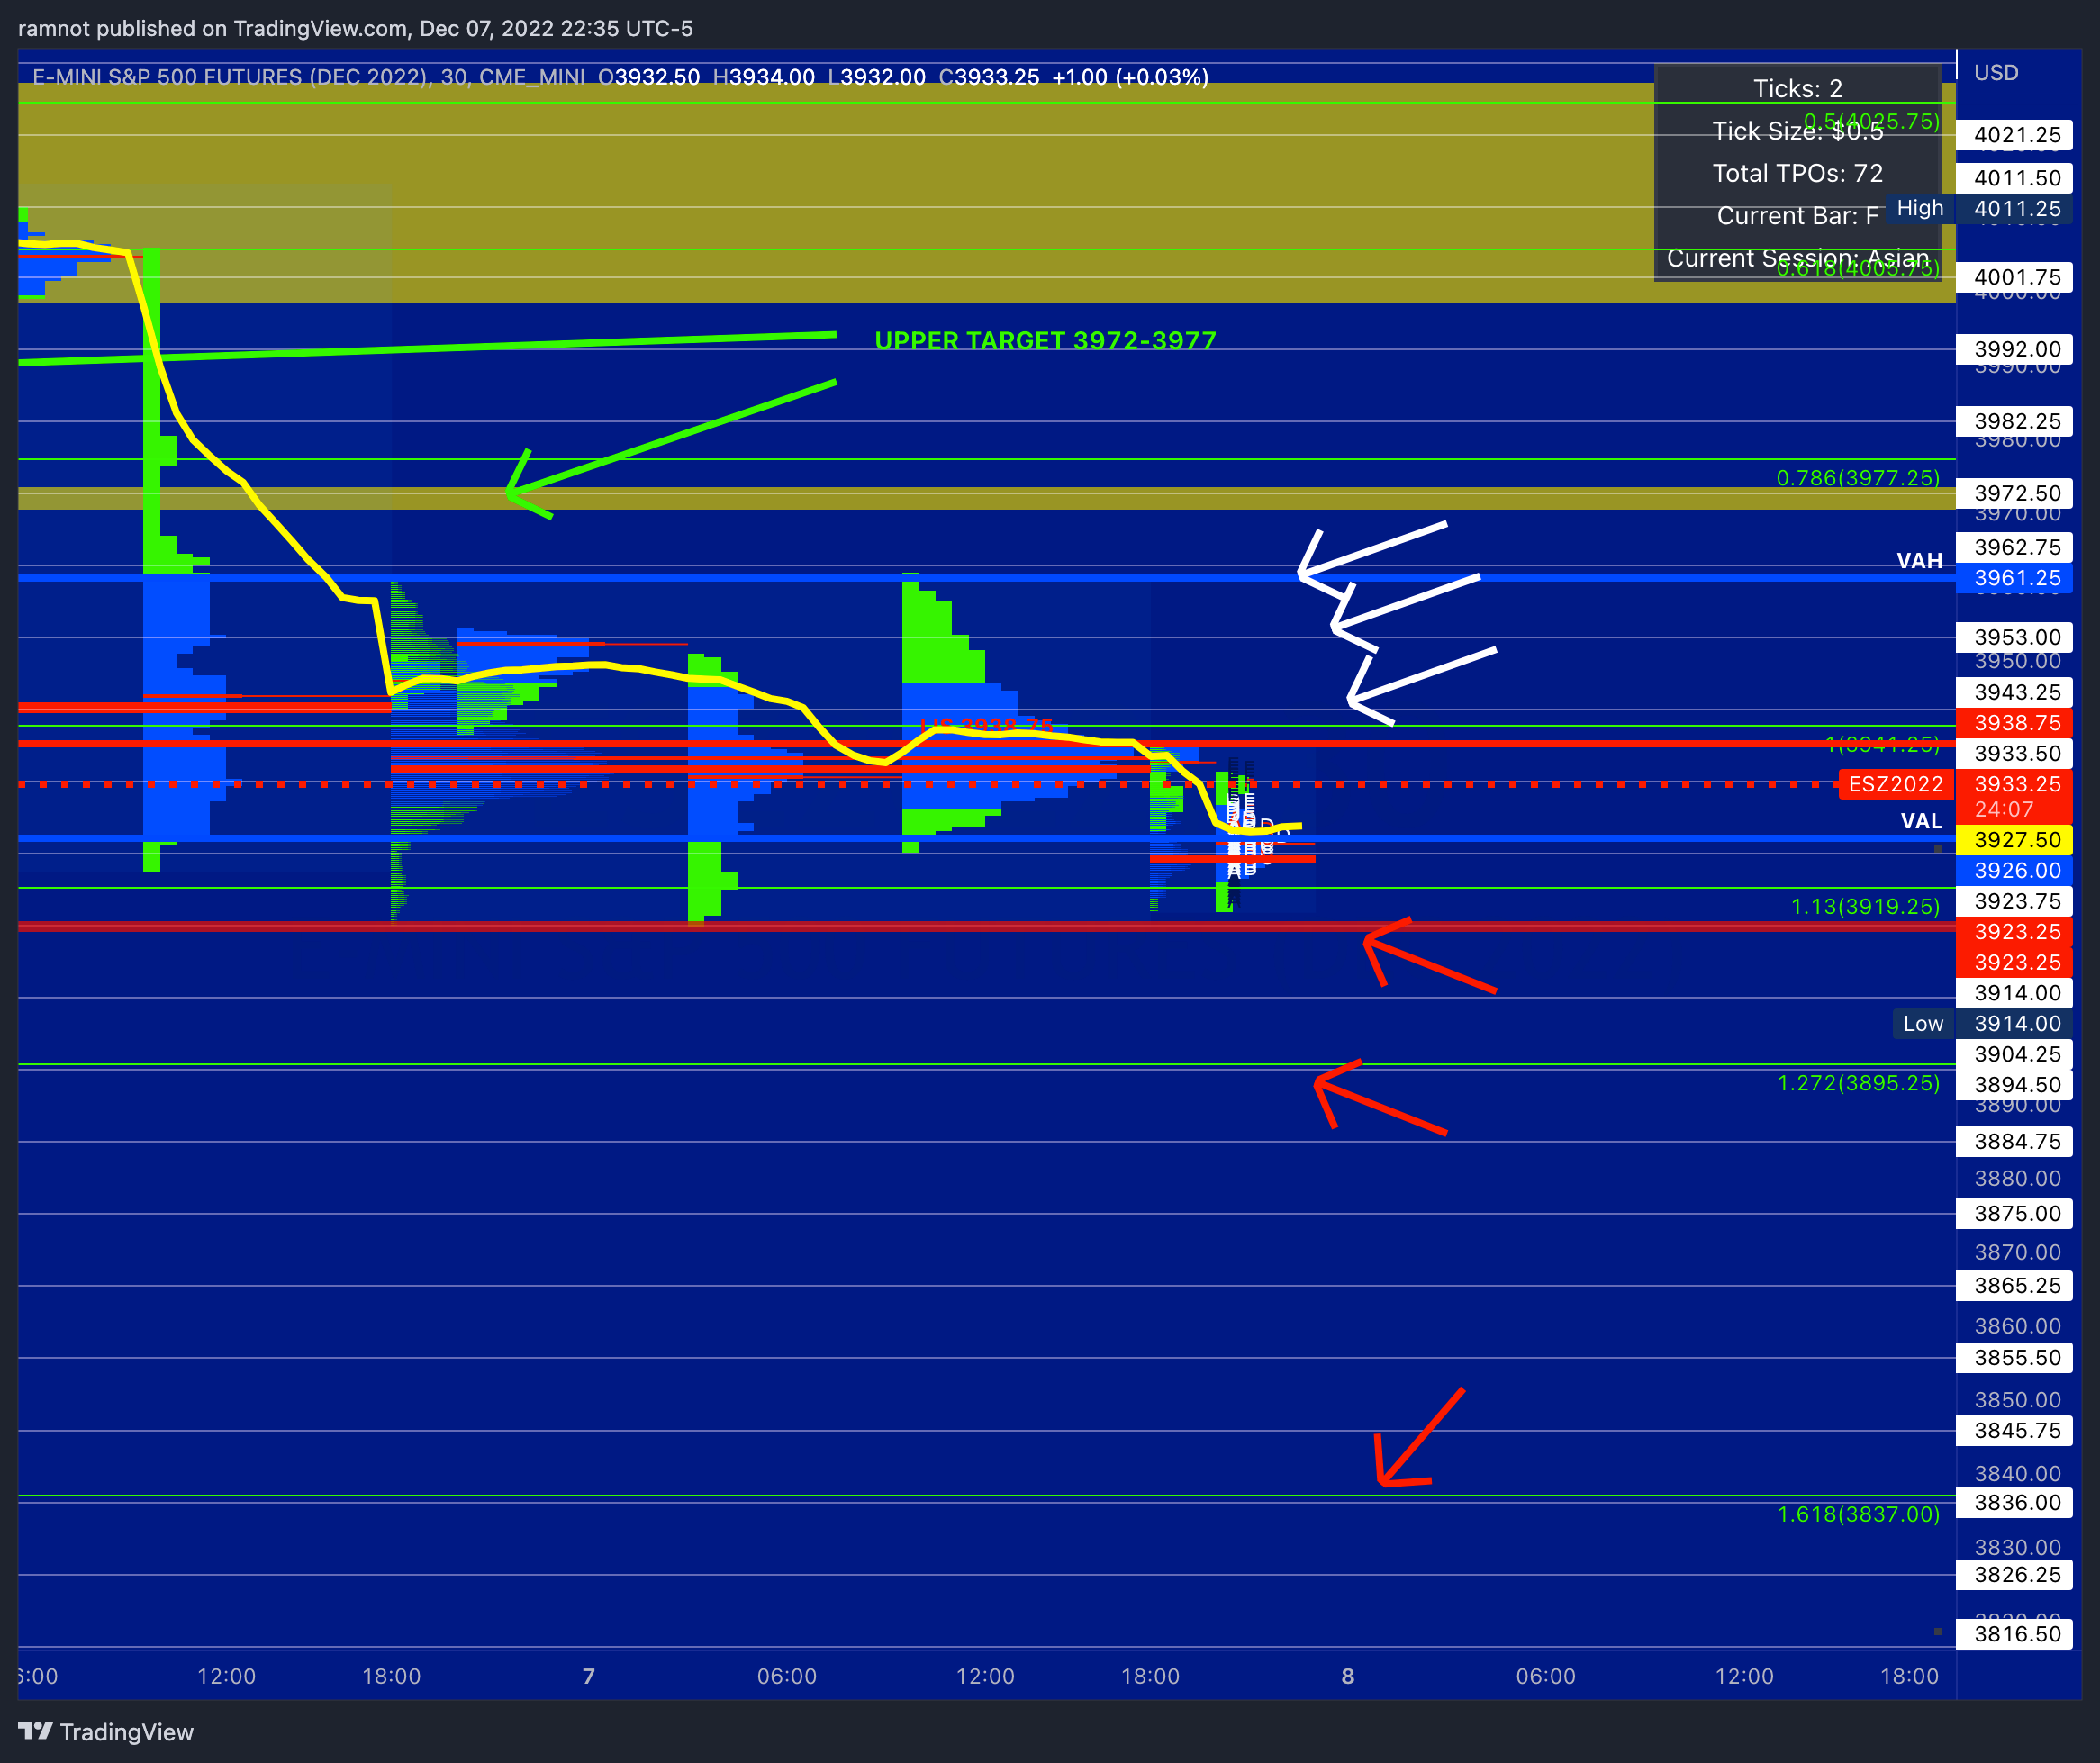
As I mentioned in my previous update, I expect the large size traders to break out of the T+2 VAH @ 3961 to the upside or T+2 VAL @ 3926 to the downside. A break above VAH/VAL will open the door to a directional trade. Once we see the TPOs one time framing up or down, we can use that as a signal for direction.
Tomorrow, my LIS is 3938.75. From this level, my targets are 3943.25, 3953, 3961.25 and then the upper targets from my previous update: 3972-3977. If we break VAL @ 3926, this will create a stop run to the downside targets of 3923, 3896 and 3837. It is important to monitor these levels closely and to follow the signals carefully in order to make informed trading decisions.
On long term timeframes, there is a gap between 3825.75 and 3870.75 and we are currently approaching support at the 50% Fib level @ 3914.75. If the market continues to sell off, we will be closely watching the reaction at 3870.75, the top of the gap, as a key level.
If net longs are able to break the downtrend at this level, this will be a potential reversal. However, if the market continues to fall below 3870.75, it could indicate further downward momentum. It is important to monitor this level and other key indicators closely in order to make informed trading decisions.

We have recently fallen below two key downtrends. The first is the solid green line at (1) on the chart, which represents the 2022 downtrend. The second is the dotted green line, which represents the 2008-2012 trendline.
If the market continues to decline below 3870.75, we expect the gap to fill and a retest of 3800. As shown on the chart, net shorts started to come back into the trade at the downtrend line that was established earlier this year at (1). It is important to monitor these levels and other key indicators carefully in order to make informed trading decisions.

Carvana, once a 350 dollar plus stock, has again shed about half of its value today, following a 90% drop from its highs. This serves as a cautionary tale for anyone who believes that a stock that is down 80-90% cannot fall another 80-90%. Despite having no clear business model, never making a profit and being built on speculation fueled by easy money, Carvana's reality has finally caught up with it.
In the worst case scenario, the company could declare bankruptcy, leading to general shareholders losing everything as they have no priority over the company's assets. In the case of Carvana, there is not much shareholder equity or assets to start with, probably around 200 million dollars, and the stock is still trading at 5X that amount even after today's drop.
The only redeeming factor about Carvana may be its brand name, as its online car sales platform and branding could be worth more than its current trading price of 3 dollars. However, the company has never made a profit and its price to revenue ratio is almost zero. This does not necessarily mean that the stock will go to zero, but deal making has been difficult this year and the company's only hope may be to go bust.
In conclusion, this is a cautionary tale for anyone who thinks that a stock that is down 80-90% cannot fall another 80-90%. In the case of Carvana, its lack of a clear business model, profitability and reliance on speculation have finally caught up with it, and the company's future remains uncertain.